基于GenBank数据库的真核生物遗传数据时空格局分析
Spatiotemporal pattern analysis of eukaryotic genetic data based on the GenBank database
基于GenBank数据库的真核生物遗传数据时空格局分析 |
| 彭欣, 刘传, 黄晓磊 |
|
Spatiotemporal pattern analysis of eukaryotic genetic data based on the GenBank database |
| Xin Peng, Chuan Liu, Xiaolei Huang |
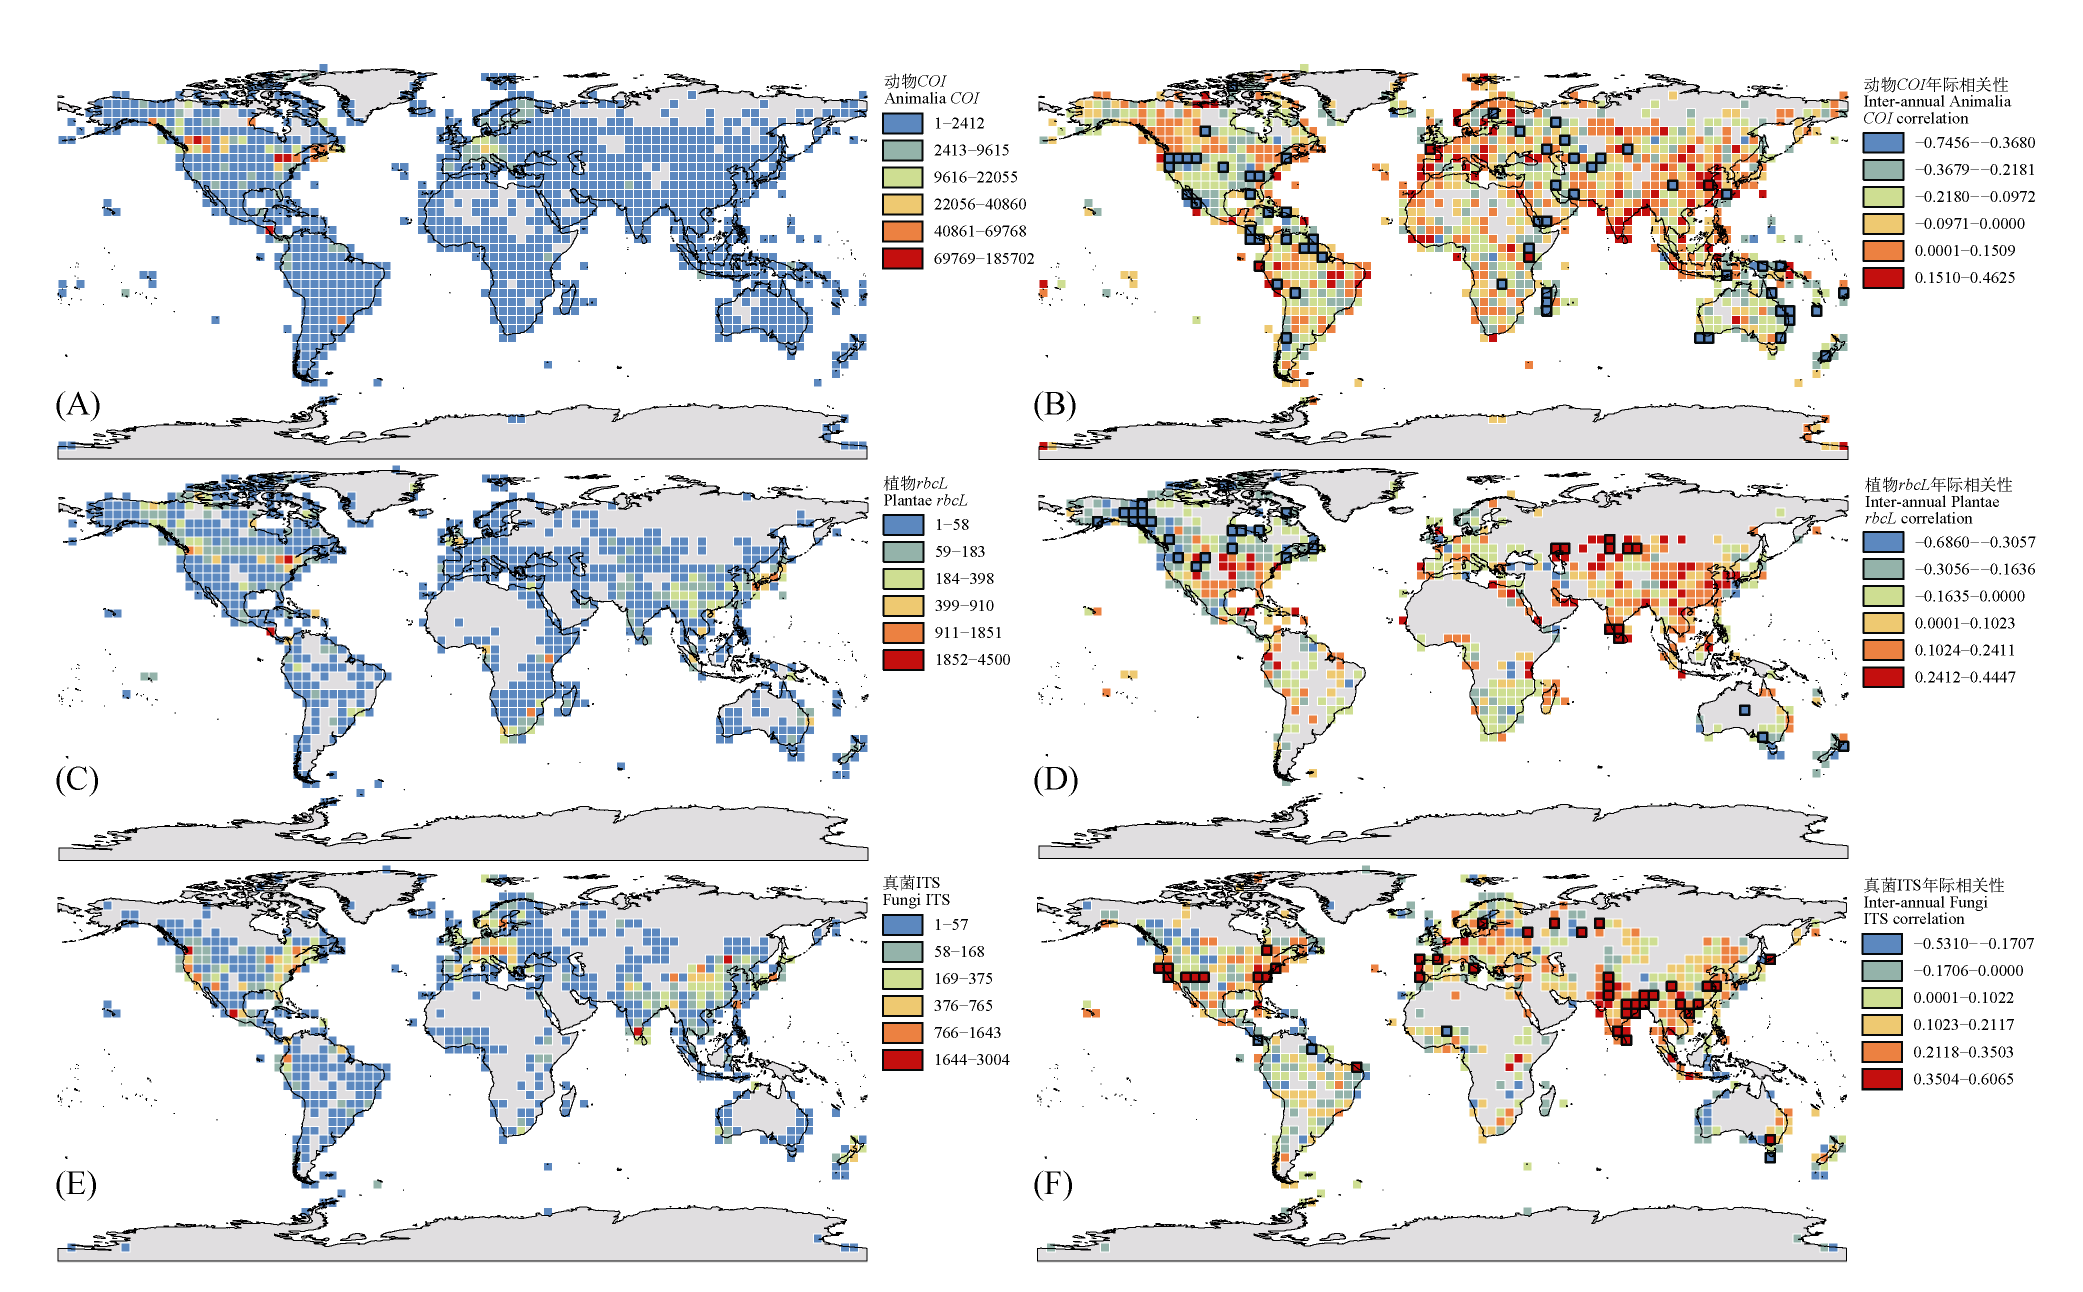
| 图1 动物界(A、B)、植物界(C、D)和真菌界(E、F)代表序列网格水平全球时空分布格局。左列(A、C、E)分别展示动物界(COI)、植物界(rbcL)和真菌界(ITS)序列的空间分布格局, 基于4° × 4°网格系统, 颜色梯度表示采用自然断点法划分的6个序列密度等级。右列(B、D、F)分别展示动物界(COI)、植物界(rbcL)和真菌界(ITS)序列的年际变化趋势, 通过一般线性模型计算各网格内序列数量与年份的相关系数(正值表示增长趋势, 负值表示下降趋势), 黑色边框表示相关系数达到显著(P < 0.05)的网格。 |
| Fig. 1 Global spatiotemporal distribution patterns of representative sequences at grid level for Animalia (A, B), Plantae (C, D), and Fungi (E, F). The left panels (A, C, E) display the spatial distribution patterns of sequences from Animalia (COI), Plantae (rbcL), and Fungi (ITS), respectively, based on a 4° × 4° grid system. The color gradient represents six sequence density levels classified using the Jenks natural breaks. The right panels (B, D, F) show the interannual trends of sequences from Animalia (COI), Plantae (rbcL), and Fungi (ITS), respectively. The correlation coefficient between sequence count and year within each grid was calculated using a general linear model (positive values indicate increasing trends, and negative values indicate decreasing trends). Grids with black borders denote statistically significant correlations (P < 0.05). |
|
|