SLOSS争论研究进展: 分析方法、理论机制及保护实践
A review of the SLOSS debate: Analysis methods, theoretical mechanisms and conservation practices
SLOSS争论研究进展: 分析方法、理论机制及保护实践 |
| 章洋, 王彦平 |
|
A review of the SLOSS debate: Analysis methods, theoretical mechanisms and conservation practices |
| Yang Zhang, Yanping Wang |
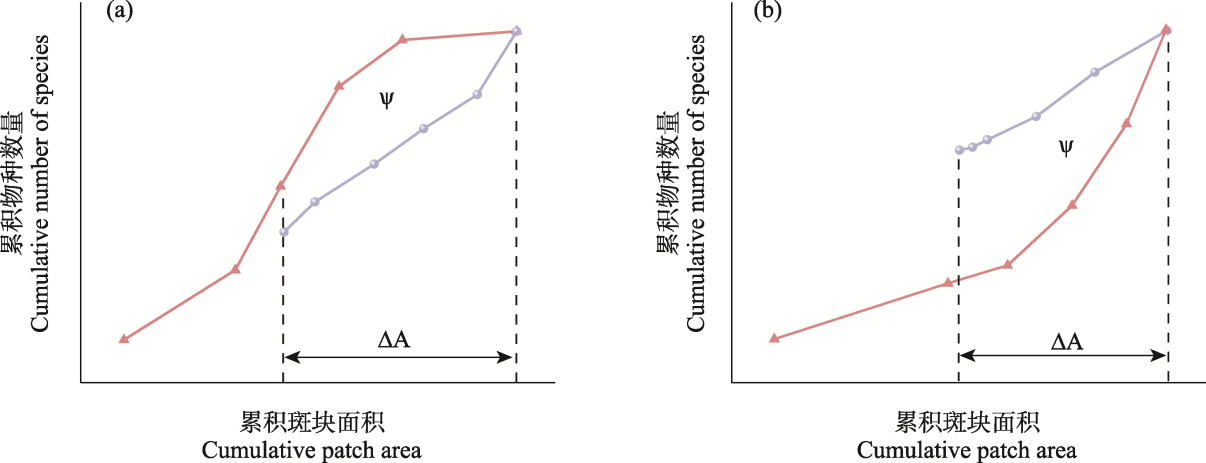
| 图3 用于表征从小到大累积曲线(红色)和从大到小累积曲线(灰色)之间偏差的ξ统计量以及指标ΔA示意图。Ψ代表从最大斑块面积推导出的两条曲线下面积的差值; ΔA表示估算两个面积的区域范围。图(a)表示ξ统计量为正的情况, 图(b)代表ξ统计量为负的情况。 |
| Fig. 3 A schematic diagram of the ξ statistic and indicator ΔA used to characterize the deviation between the small to large cumulative curve (red) and the large to small cumulative curve (gray). Ψ represents the difference between the areas under the two curves extrapolated from the maximum patch area. ΔA refers to the extent of the area used to estimate the two areas. Figure (a) represents the case where the ξ statistic is positive and figure (b) represents the case where the ξ statistic is negative. |
|
|