SLOSS争论研究进展: 分析方法、理论机制及保护实践
A review of the SLOSS debate: Analysis methods, theoretical mechanisms and conservation practices
SLOSS争论研究进展: 分析方法、理论机制及保护实践 |
| 章洋, 王彦平 |
|
A review of the SLOSS debate: Analysis methods, theoretical mechanisms and conservation practices |
| Yang Zhang, Yanping Wang |
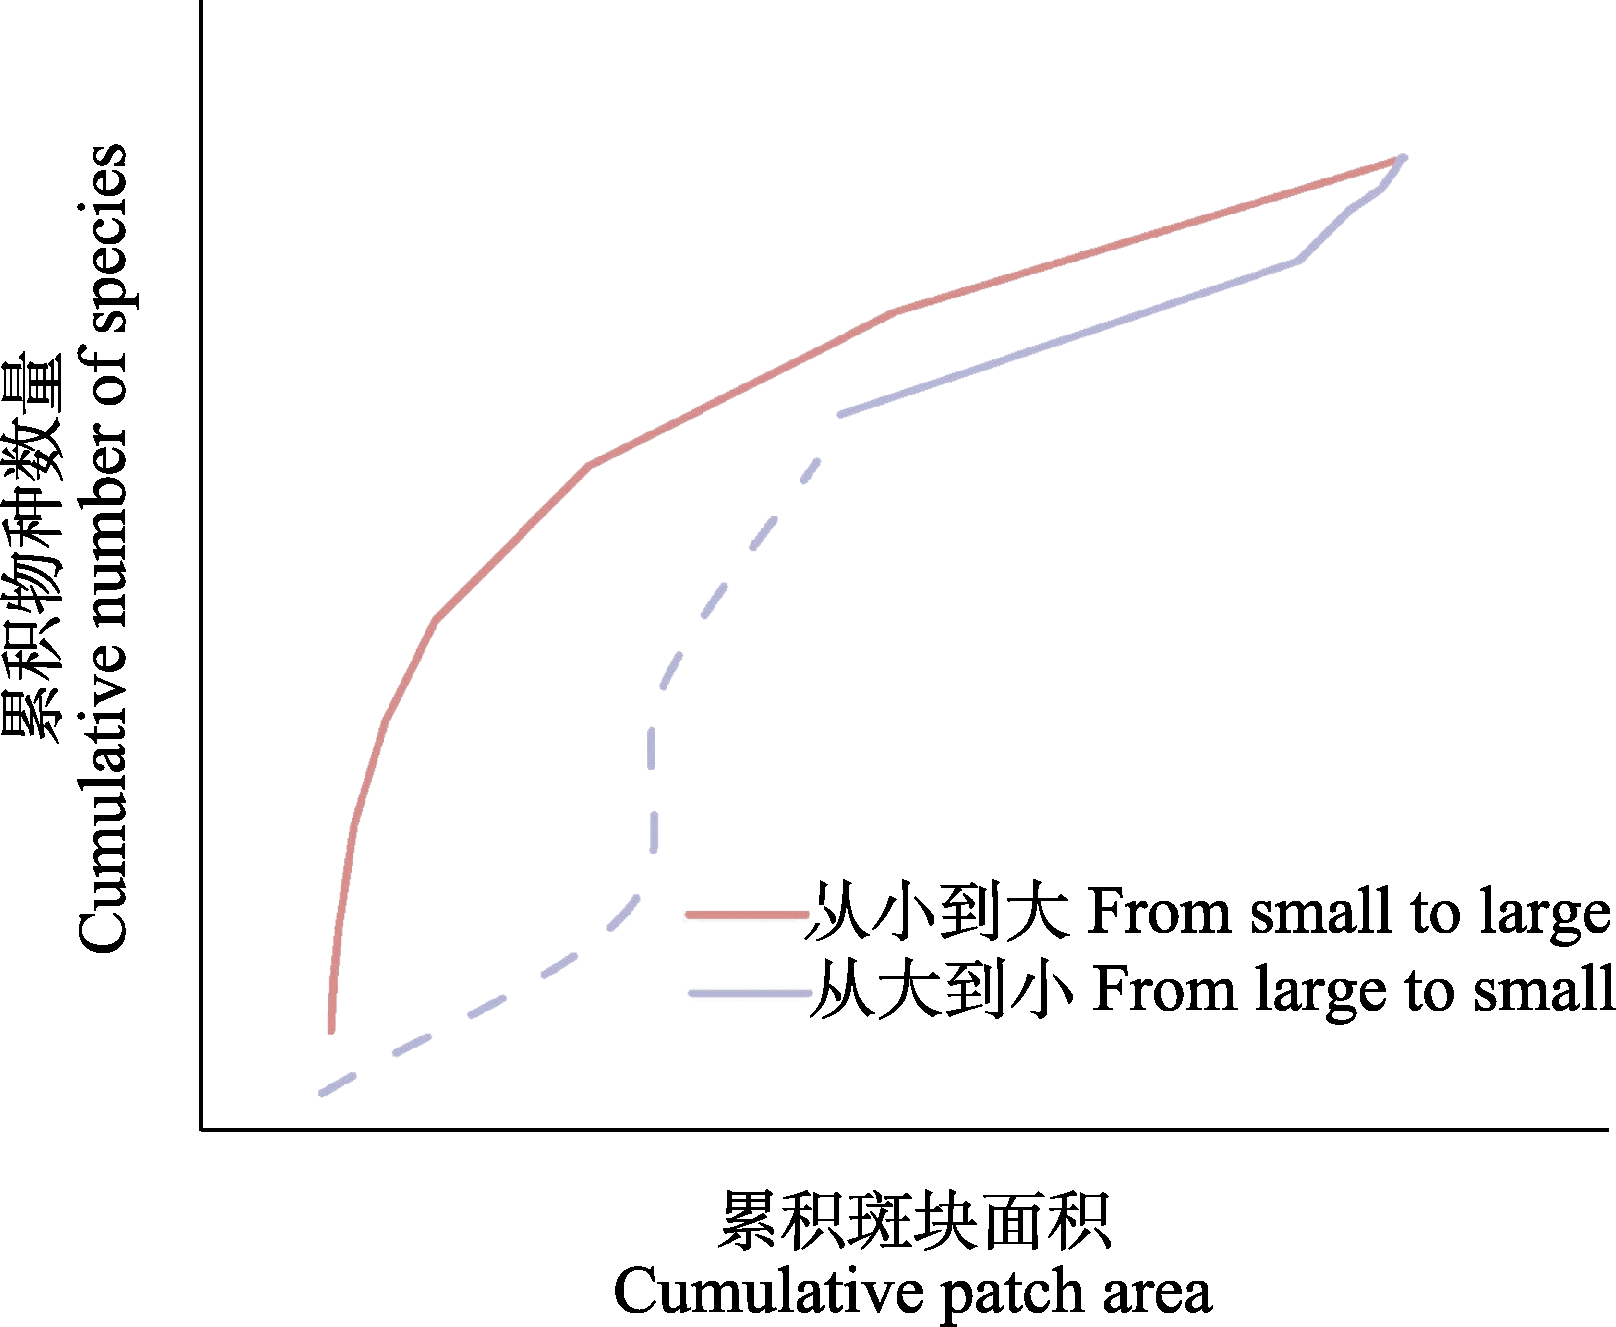
| 图2 累积种-面积关系曲线示意图。数据点之间的线段按S = cAz进行非线性插值而来, 虚线代表从大到小曲线上的最大斑块面积对应的点与原点的非线性累积趋势。 |
| Fig. 2 Schematic diagram of cumulative species-area relationship curve. Lines between data points are nonlinearly interpolated by S = cAz. The dotted line represents the nonlinear cumulative trend between the point corresponding to the largest patch area on the curve from large to small and the origin point. |
|
|