北京地区油松与大叶黄杨叶际表生真菌多样性及群落组成
Diversity and community composition of epiphytic fungi in the phyllosphere of Pinus tabuliformis and Euonymus japonicus in Beijing, northern China
北京地区油松与大叶黄杨叶际表生真菌多样性及群落组成 |
| 崔玉进, 李婉莹, 周青青, 赵恒, 吴芳, 员瑗 |
|
Diversity and community composition of epiphytic fungi in the phyllosphere of Pinus tabuliformis and Euonymus japonicus in Beijing, northern China |
| Yujin Cui, Wanying Li, Qingqing Zhou, Heng Zhao, Fang Wu, Yuan Yuan |
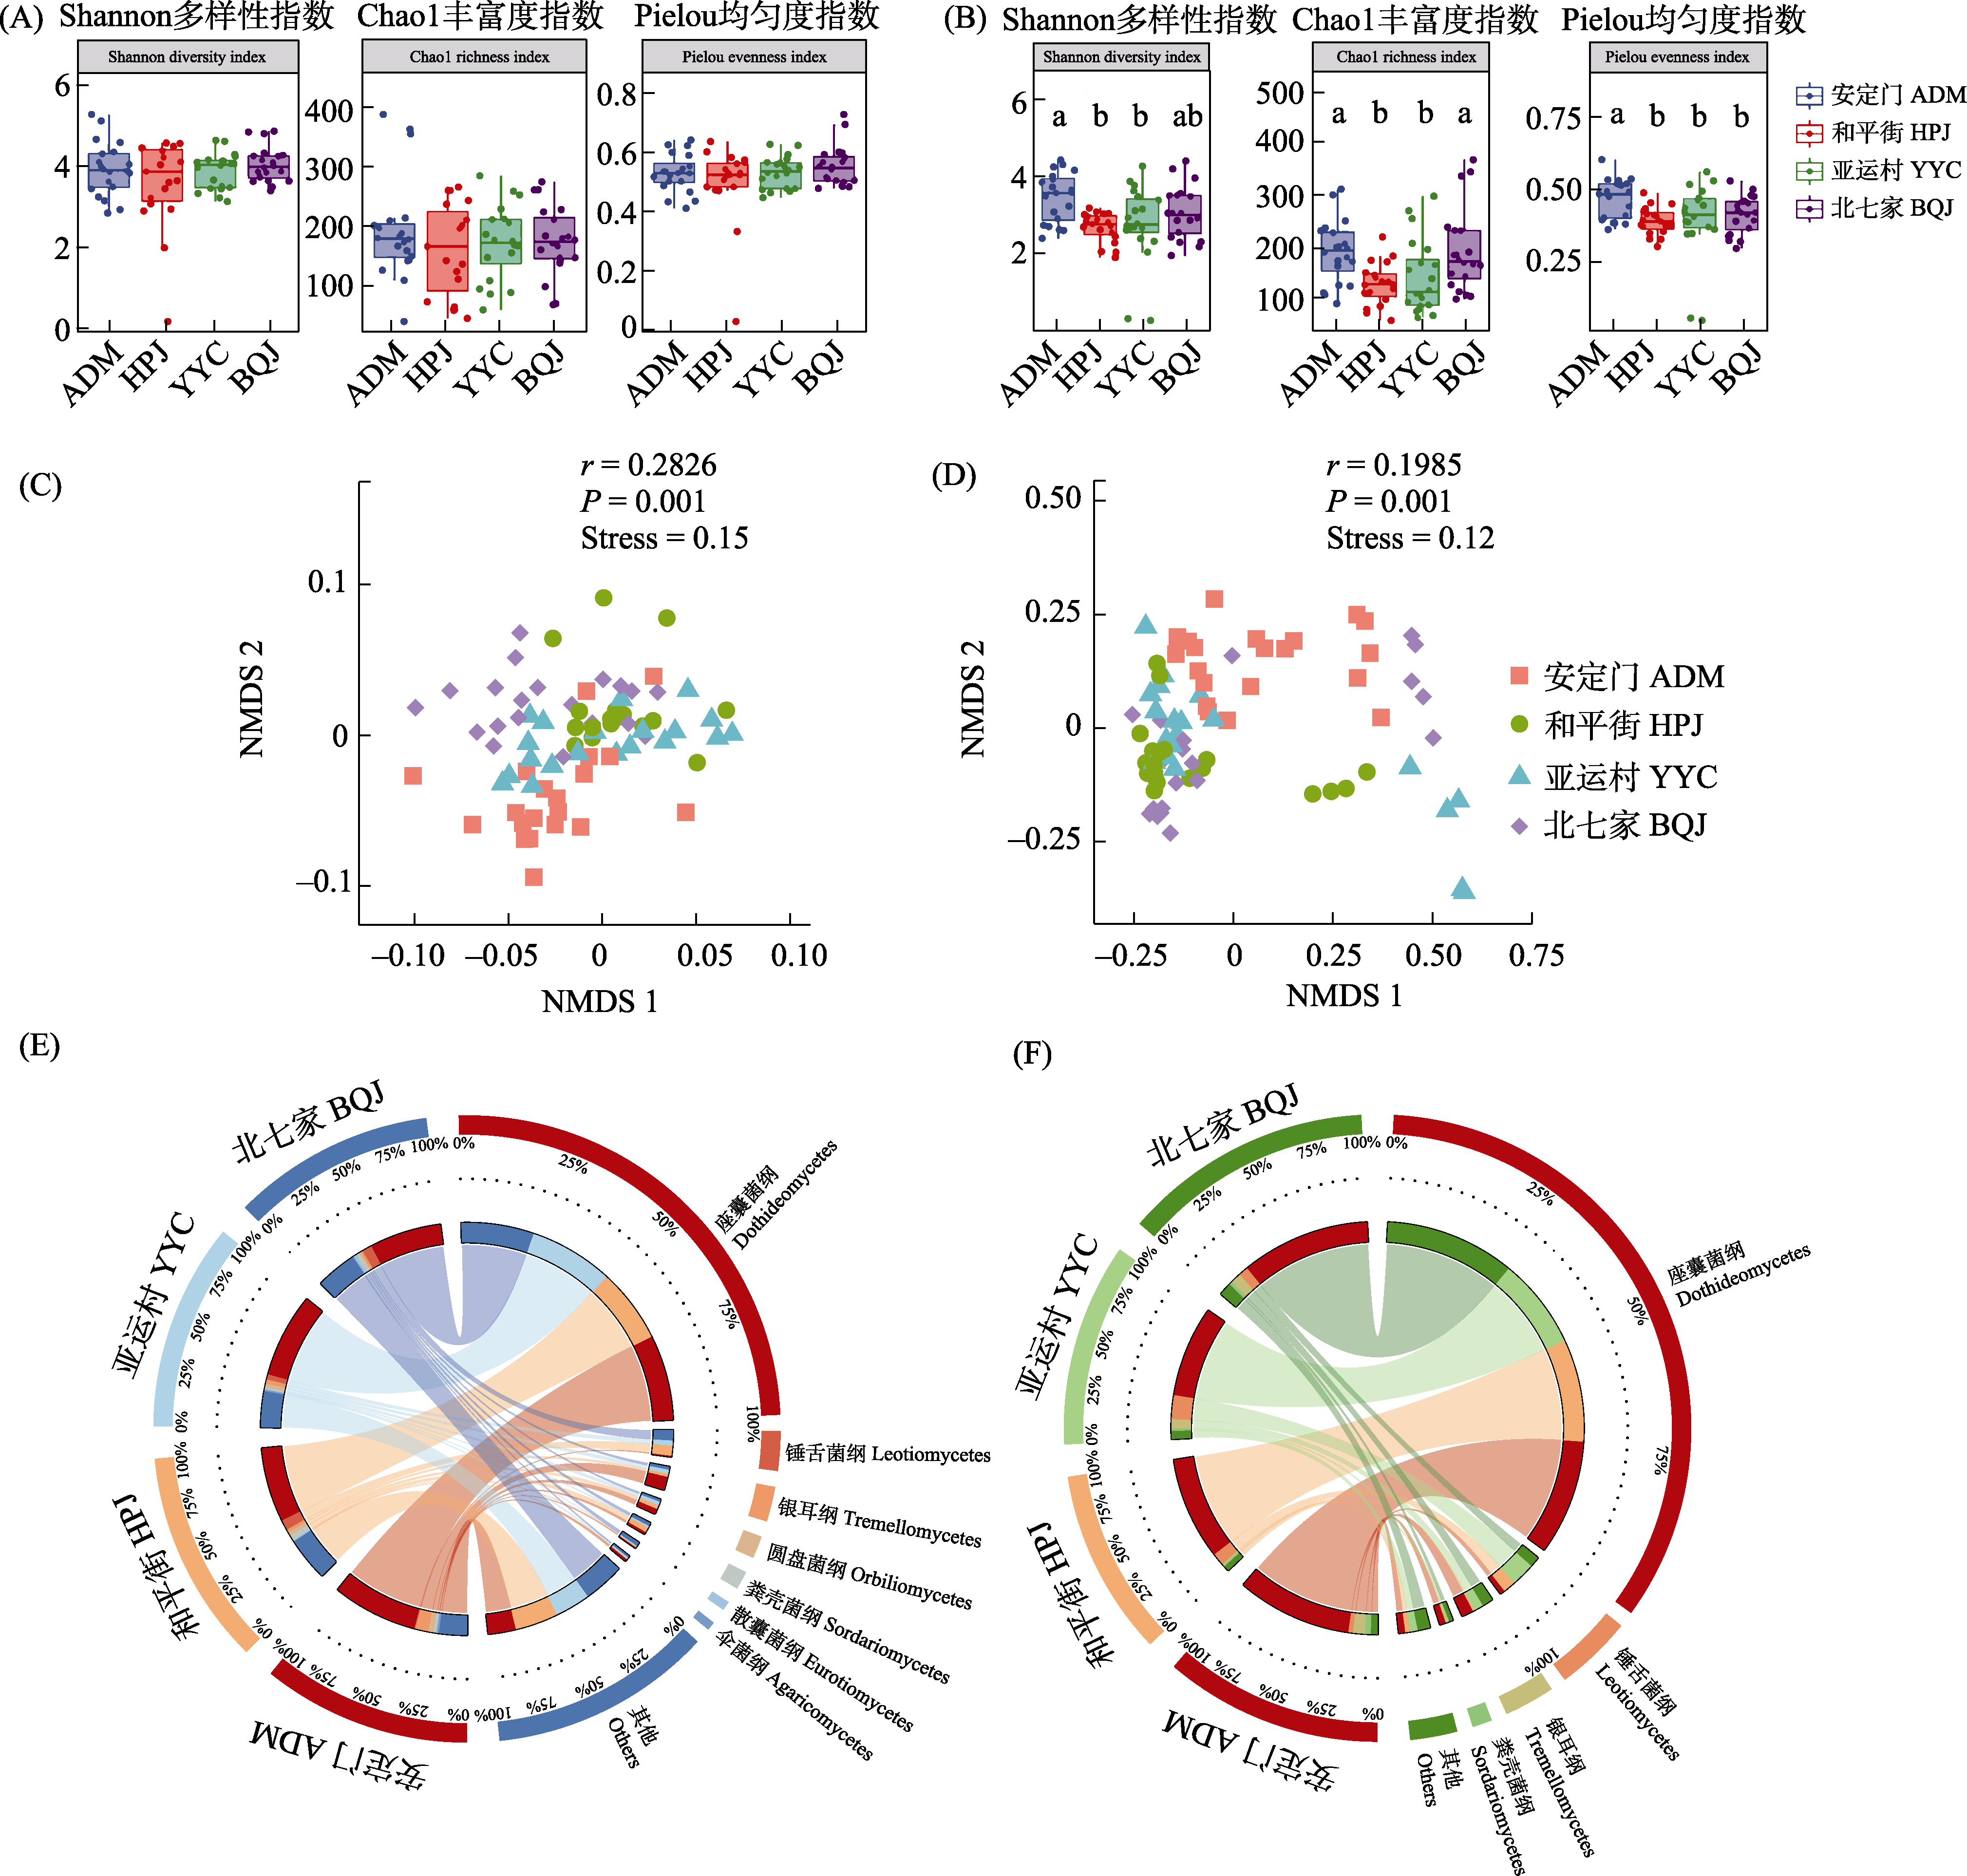
| 图3 油松与大叶黄杨的叶际表生真菌在不同样点间的多样性与纲水平群落组成。A: 油松的α多样性指数; B: 大叶黄杨的α多样性指数; C: 油松的NMDS分析; D: 大叶黄杨的NMDS分析; E: 油松的群落结构; F: 大叶黄杨的群落结构。箱线图中的不同小写字母表示组间差异显著(Kruskal-Wallis, P < 0.05)。r表示样点间的相似程度。r数值越大, 差异越大。样点缩写全称见 |
| Fig. 3 The diversity and class level community structure of epiphytic fungi in the phyllosphere of Pinus tabuliformis and Euonymus japonicus among different sampling plots. A, The alpha diversity index of P. tabuliformis; B, The alpha diversity index of E. japonicus; C, Non-metric multidimensional scaling analysis of P. tabuliformis; D, Non-metric multidimensional scaling analysis of E. japonicus; E, The community structure of P. tabuliformis; F, The community structure of E. japonicus. Different letters in the box plot indicates that there was significant difference between groups (Kruskal-Wallis, P < 0.05). r denotes the degree of similarity between sample points. The larger the value of, the greater the difference. Full names of sample plot abbreviations see |
|
|