基于被动声学监测技术的城市绿地景观格局与鸟类多样性关联分析
Correlation analysis of urban green landscape patterns and bird diversity based on passive acoustic monitoring technology
基于被动声学监测技术的城市绿地景观格局与鸟类多样性关联分析 |
| 李乐, 张承云, 裴男才, 高丙涛, 王娜, 李嘉睿, 武瑞琛, 郝泽周 |
|
Correlation analysis of urban green landscape patterns and bird diversity based on passive acoustic monitoring technology |
| Le Li, Chengyun Zhang, Nancai Pei, Bingtao Gao, Na Wang, Jiarui Li, Ruichen Wu, Zezhou Hao |
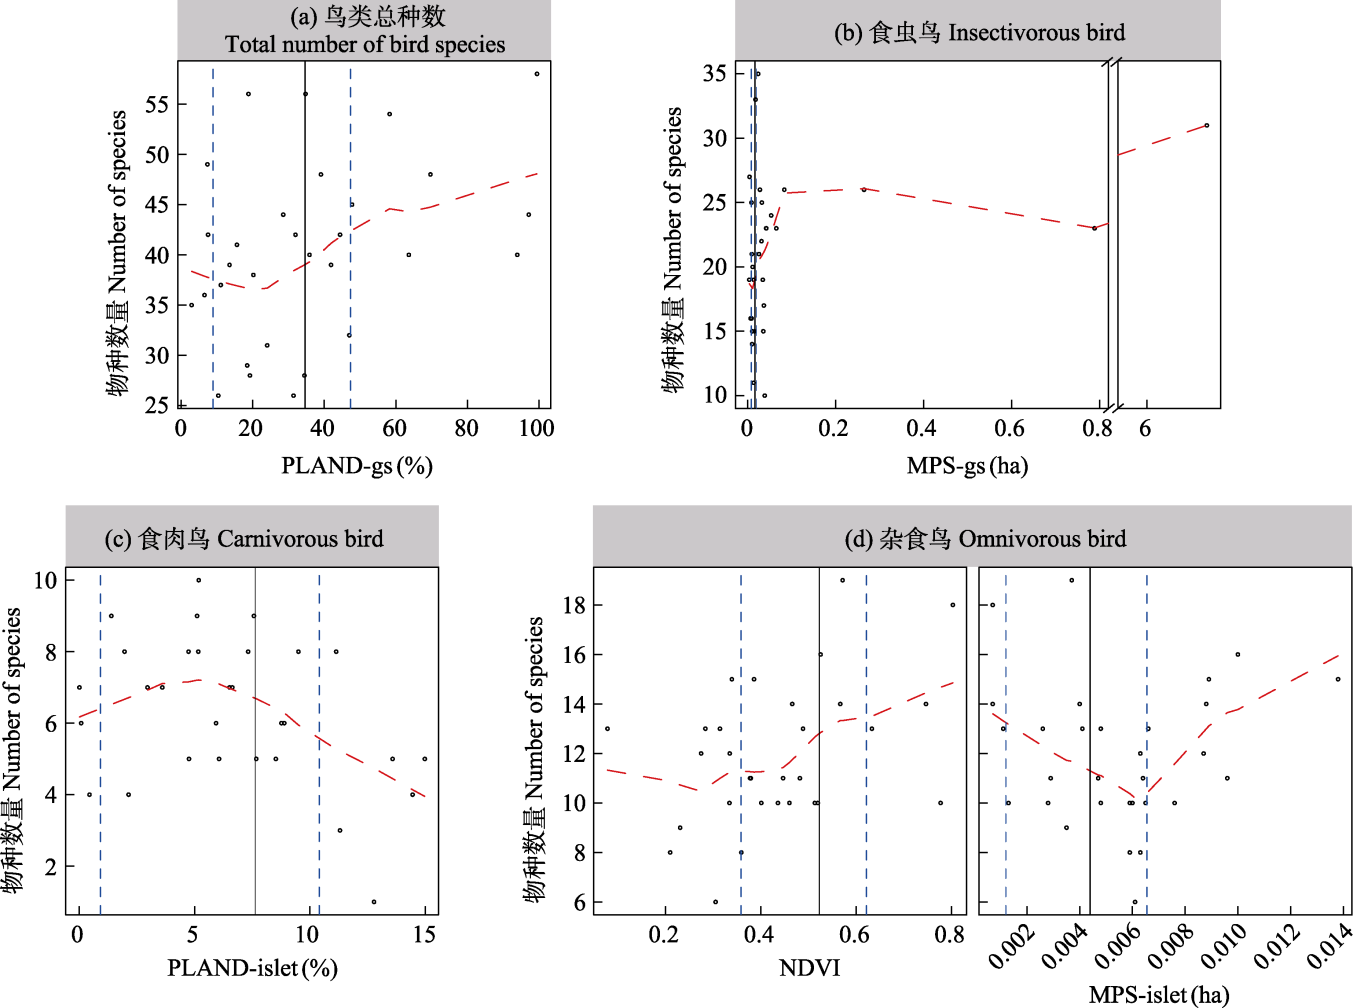
| 图7 景观指数与鸟类物种数量的散点矩阵与Loess拟合曲线(蓝色虚线为置信区间, 黑色实线为景观阈值)。NDVI: 归一化植被指数; PLAND-gs: 绿地面积比例; MPS-gs: 绿地平均斑块面积; PLAND-islet: 孤岛面积比例; MPS-islet: 孤岛平均斑块面积。 |
| Fig. 7 Scattered matrix and loess fitting curve of landscape metrics and bird species numbers (Blue dashed line represents the lower and upper confidence limits, black solid line represents the landscape threshold). NDVI, Normalized difference vegetation index; PLAND-gs, Proportion of green space; MPS-gs, Mean patch size of green space; PLAND-islet, Proportion of islet; MPS-islet, Mean patch size of islet. |
|
|