基于被动声学监测技术的城市绿地景观格局与鸟类多样性关联分析
Correlation analysis of urban green landscape patterns and bird diversity based on passive acoustic monitoring technology
基于被动声学监测技术的城市绿地景观格局与鸟类多样性关联分析 |
| 李乐, 张承云, 裴男才, 高丙涛, 王娜, 李嘉睿, 武瑞琛, 郝泽周 |
|
Correlation analysis of urban green landscape patterns and bird diversity based on passive acoustic monitoring technology |
| Le Li, Chengyun Zhang, Nancai Pei, Bingtao Gao, Na Wang, Jiarui Li, Ruichen Wu, Zezhou Hao |
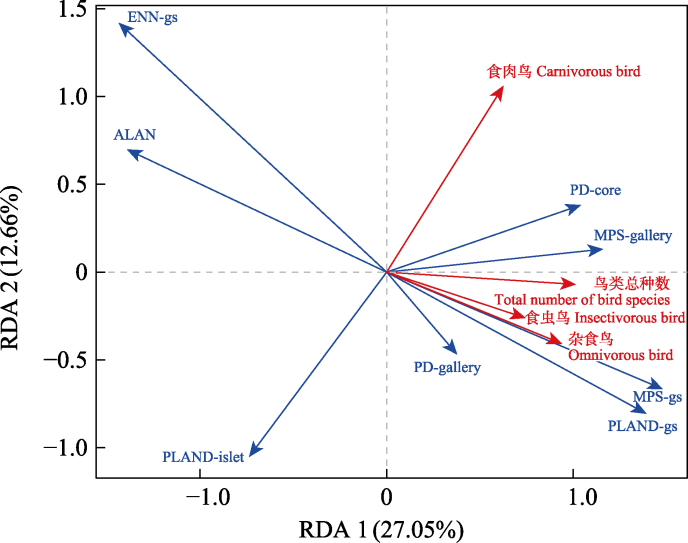
| 图4 景观特征和鸟类物种数量的冗余分析(RDA)排序图(红色箭头为目标变量, 蓝色箭头为解释变量)。PLAND-gs: 绿地面积比例; MPS-gs: 绿地平均斑块面积; ENN-gs: 绿地斑块平均邻近距离; PLAND-islet: 孤岛面积比例; PD-gallery: 廊道斑块密度; PD-core: 核心斑块密度; MPS-gallery: 廊道平均斑块面积; ALAN: 人造夜间灯光。 |
| Fig. 4 Redundancy analysis (RDA) ordination plot of landscape features and bird species numbers (Red arrows represent target variables, blue arrows represent explanatory variables). PLAND-gs, Proportion of green space; MPS-gs, Mean patch size of green space; ENN-gs, Mean nearest-neighbor distance of green patches; PLAND-islet, Proportion of islet; PD-gallery, Patch density of gallery; PD-core, Patch density of core; MPS-gallery, Mean patch size of gallery; ALAN, Artificial night-time light. |
|
|