南岭哺乳类和鸟类物种丰富度空间分布格局及其影响因子
Species richness patterns of mammals and birds and their drivers in the Nanling Mountain Range
南岭哺乳类和鸟类物种丰富度空间分布格局及其影响因子 |
| 王丽媛, 胡慧建, 姜杰, 胡一鸣 |
|
Species richness patterns of mammals and birds and their drivers in the Nanling Mountain Range |
| Liyuan Wang, Huijian Hu, Jie Jiang, Yiming Hu |
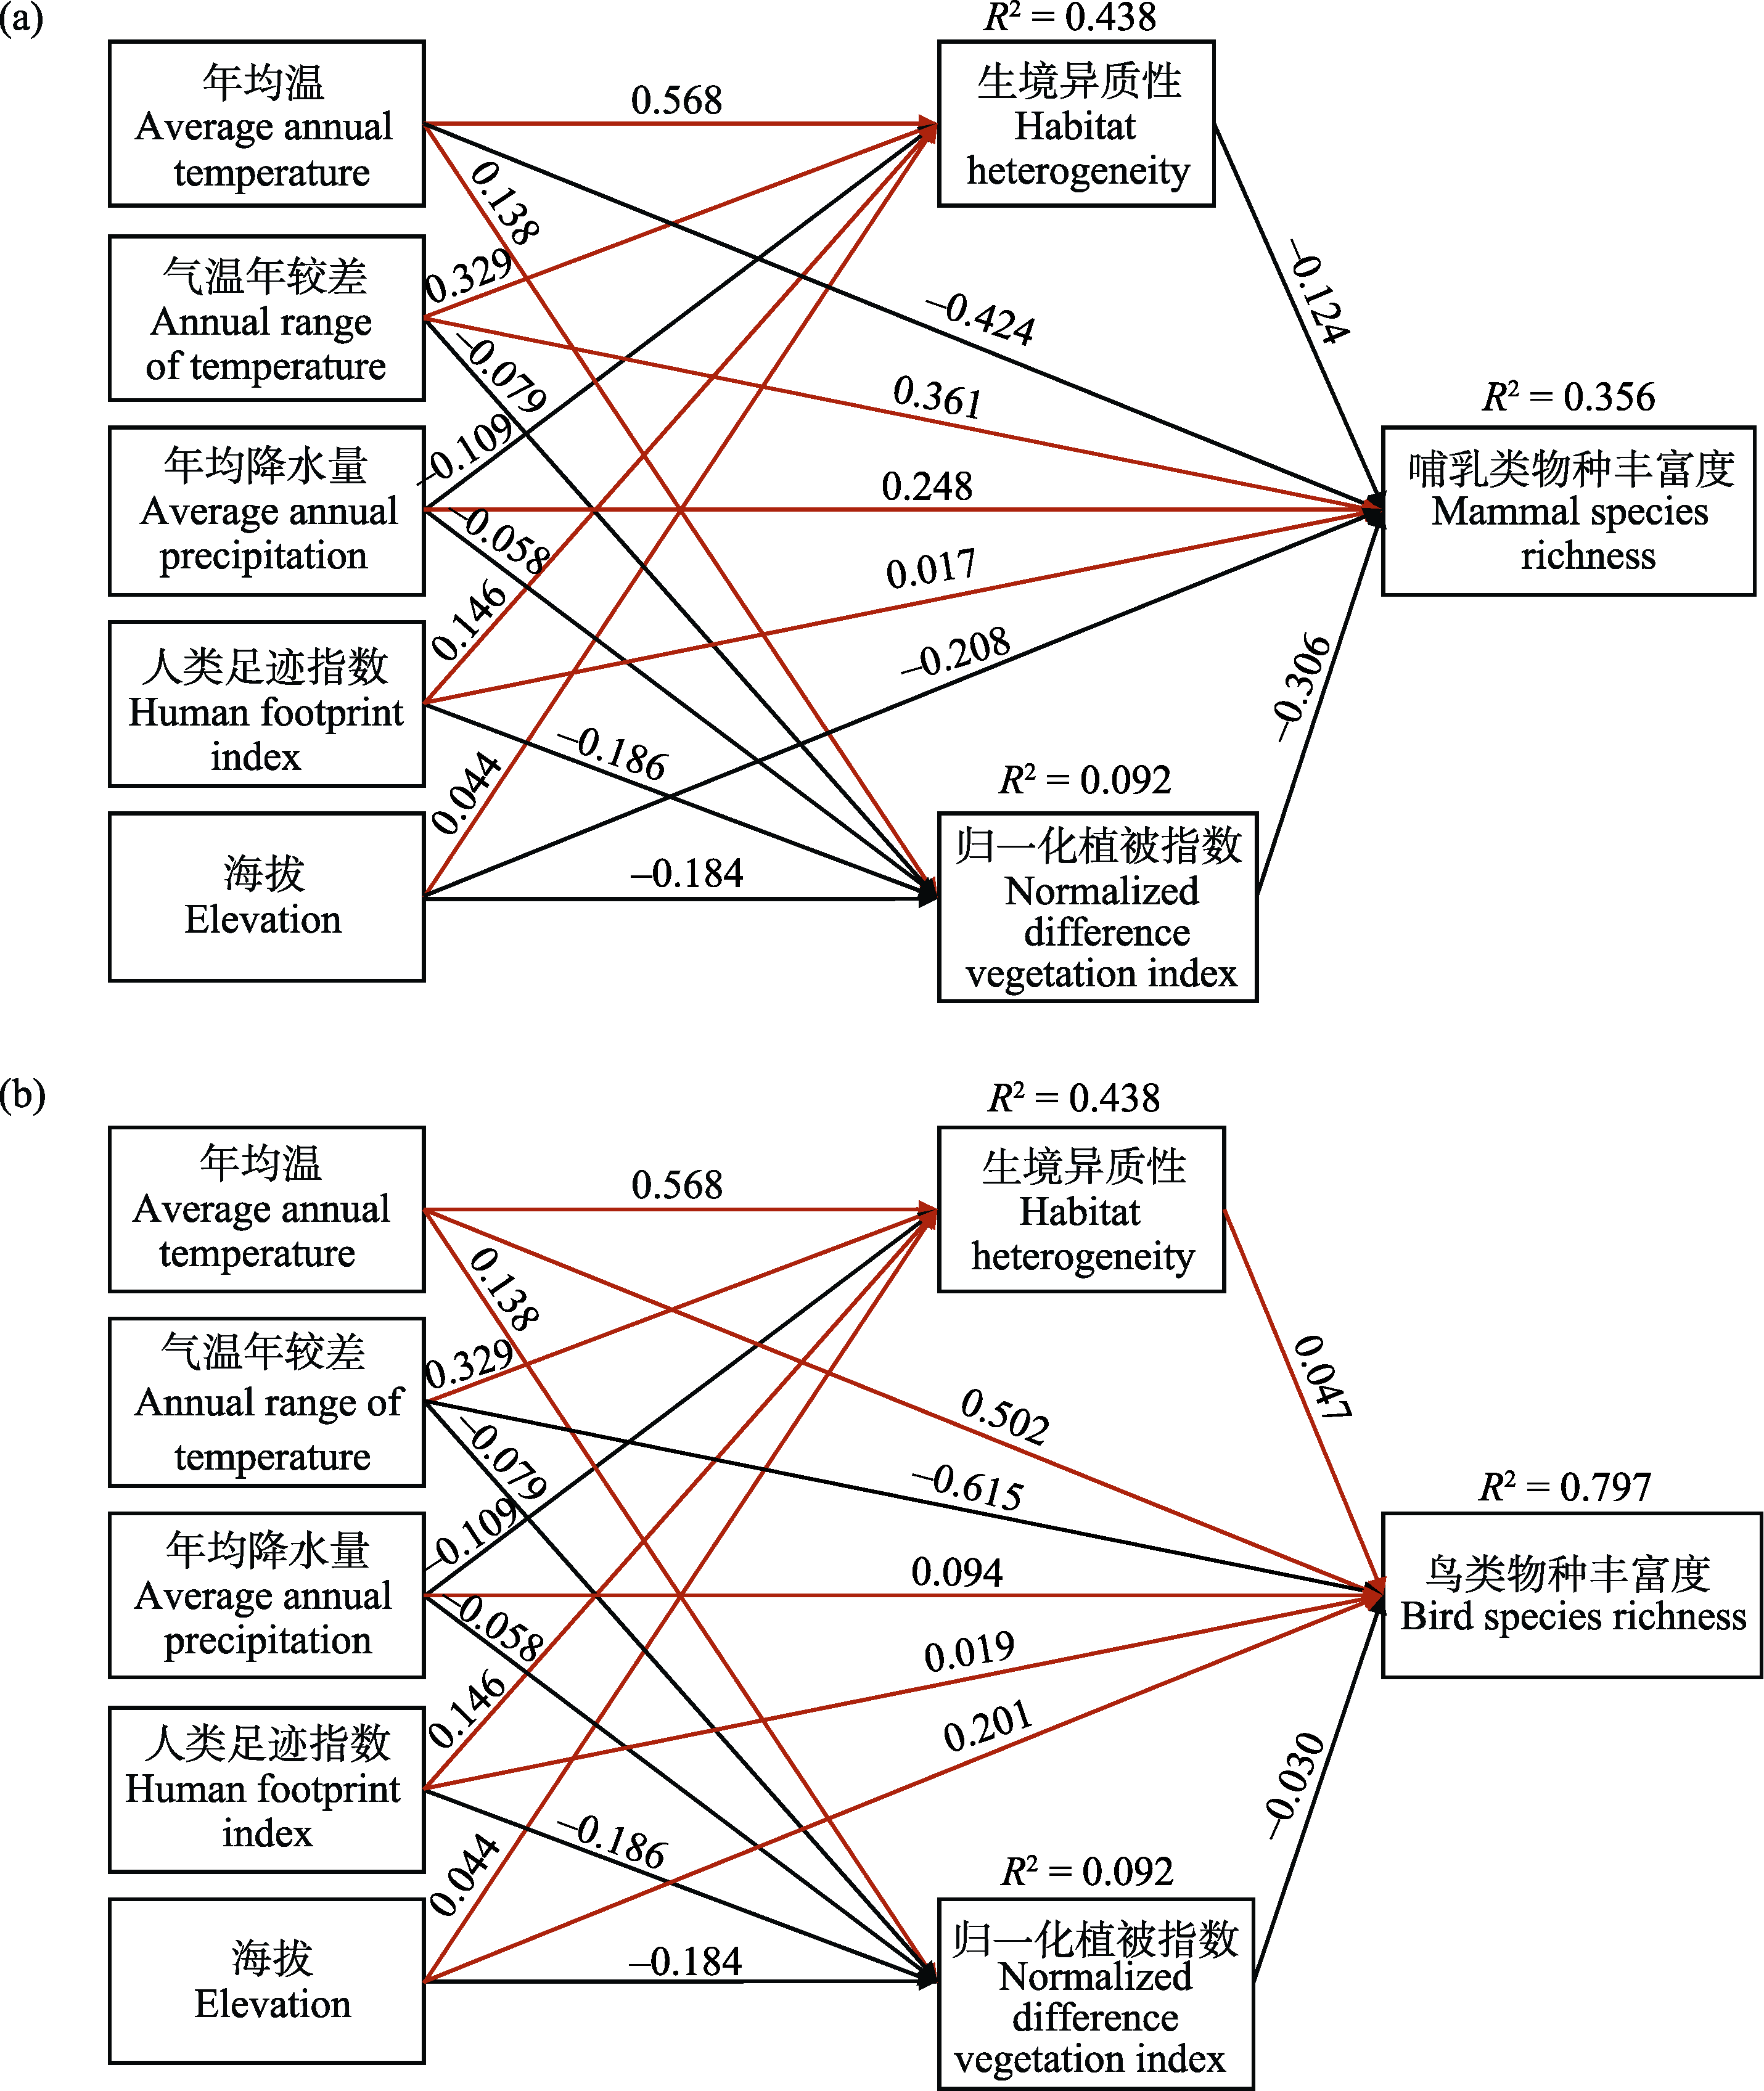
| 图3 各变量(年均温、气温年较差、年均降水量、人类足迹指数、海拔、生境异质性和归一化植被指数)对南岭地区物种丰富度空间分布格局的直接和间接效应路径图。a: 哺乳类; GFI = 0.987; CFI = 0.978; IFI = 0.978。b: 鸟类; GFI = 0.997; CFI = 0.989; IFI = 0.989。红色和黑色箭头分别表示正效应和负效应; 箭头边的数字表示标准化系数, 且所有系数的P值均小于0.05; 图中标明了三个模型集的R2。 |
| Fig. 3 The path diagram of direct and indirect effects of variables (average annual temperature, annual range of temperature, average annual precipitation, human footprint index, elevation, habitat heterogeneity, normalized difference vegetation index) on the spatial distribution pattern of species richness in the Nanling region. a, Mammal; GFI = 0.987; CFI = 0.978; IFI = 0.978. b, Bird; GFI = 0.997; CFI = 0.989; IFI = 0.989. Red and black arrows indicate positive and negative effects respectively; numbers along the arrows represent standardized coefficients and the P-values of all coefficients were less than 0.05; R2 of the three model sets is given in the figure. |
|
|