戴云山国家级自然保护区访花昆虫DNA条形码数据集
DNA barcode reference dataset for flower-visiting insects in Daiyun Mountain National Nature Reserve
戴云山国家级自然保护区访花昆虫DNA条形码数据集 |
| 罗小燕, 李强, 黄晓磊 |
|
DNA barcode reference dataset for flower-visiting insects in Daiyun Mountain National Nature Reserve |
| Xiaoyan Luo, Qiang Li, Xiaolei Huang |
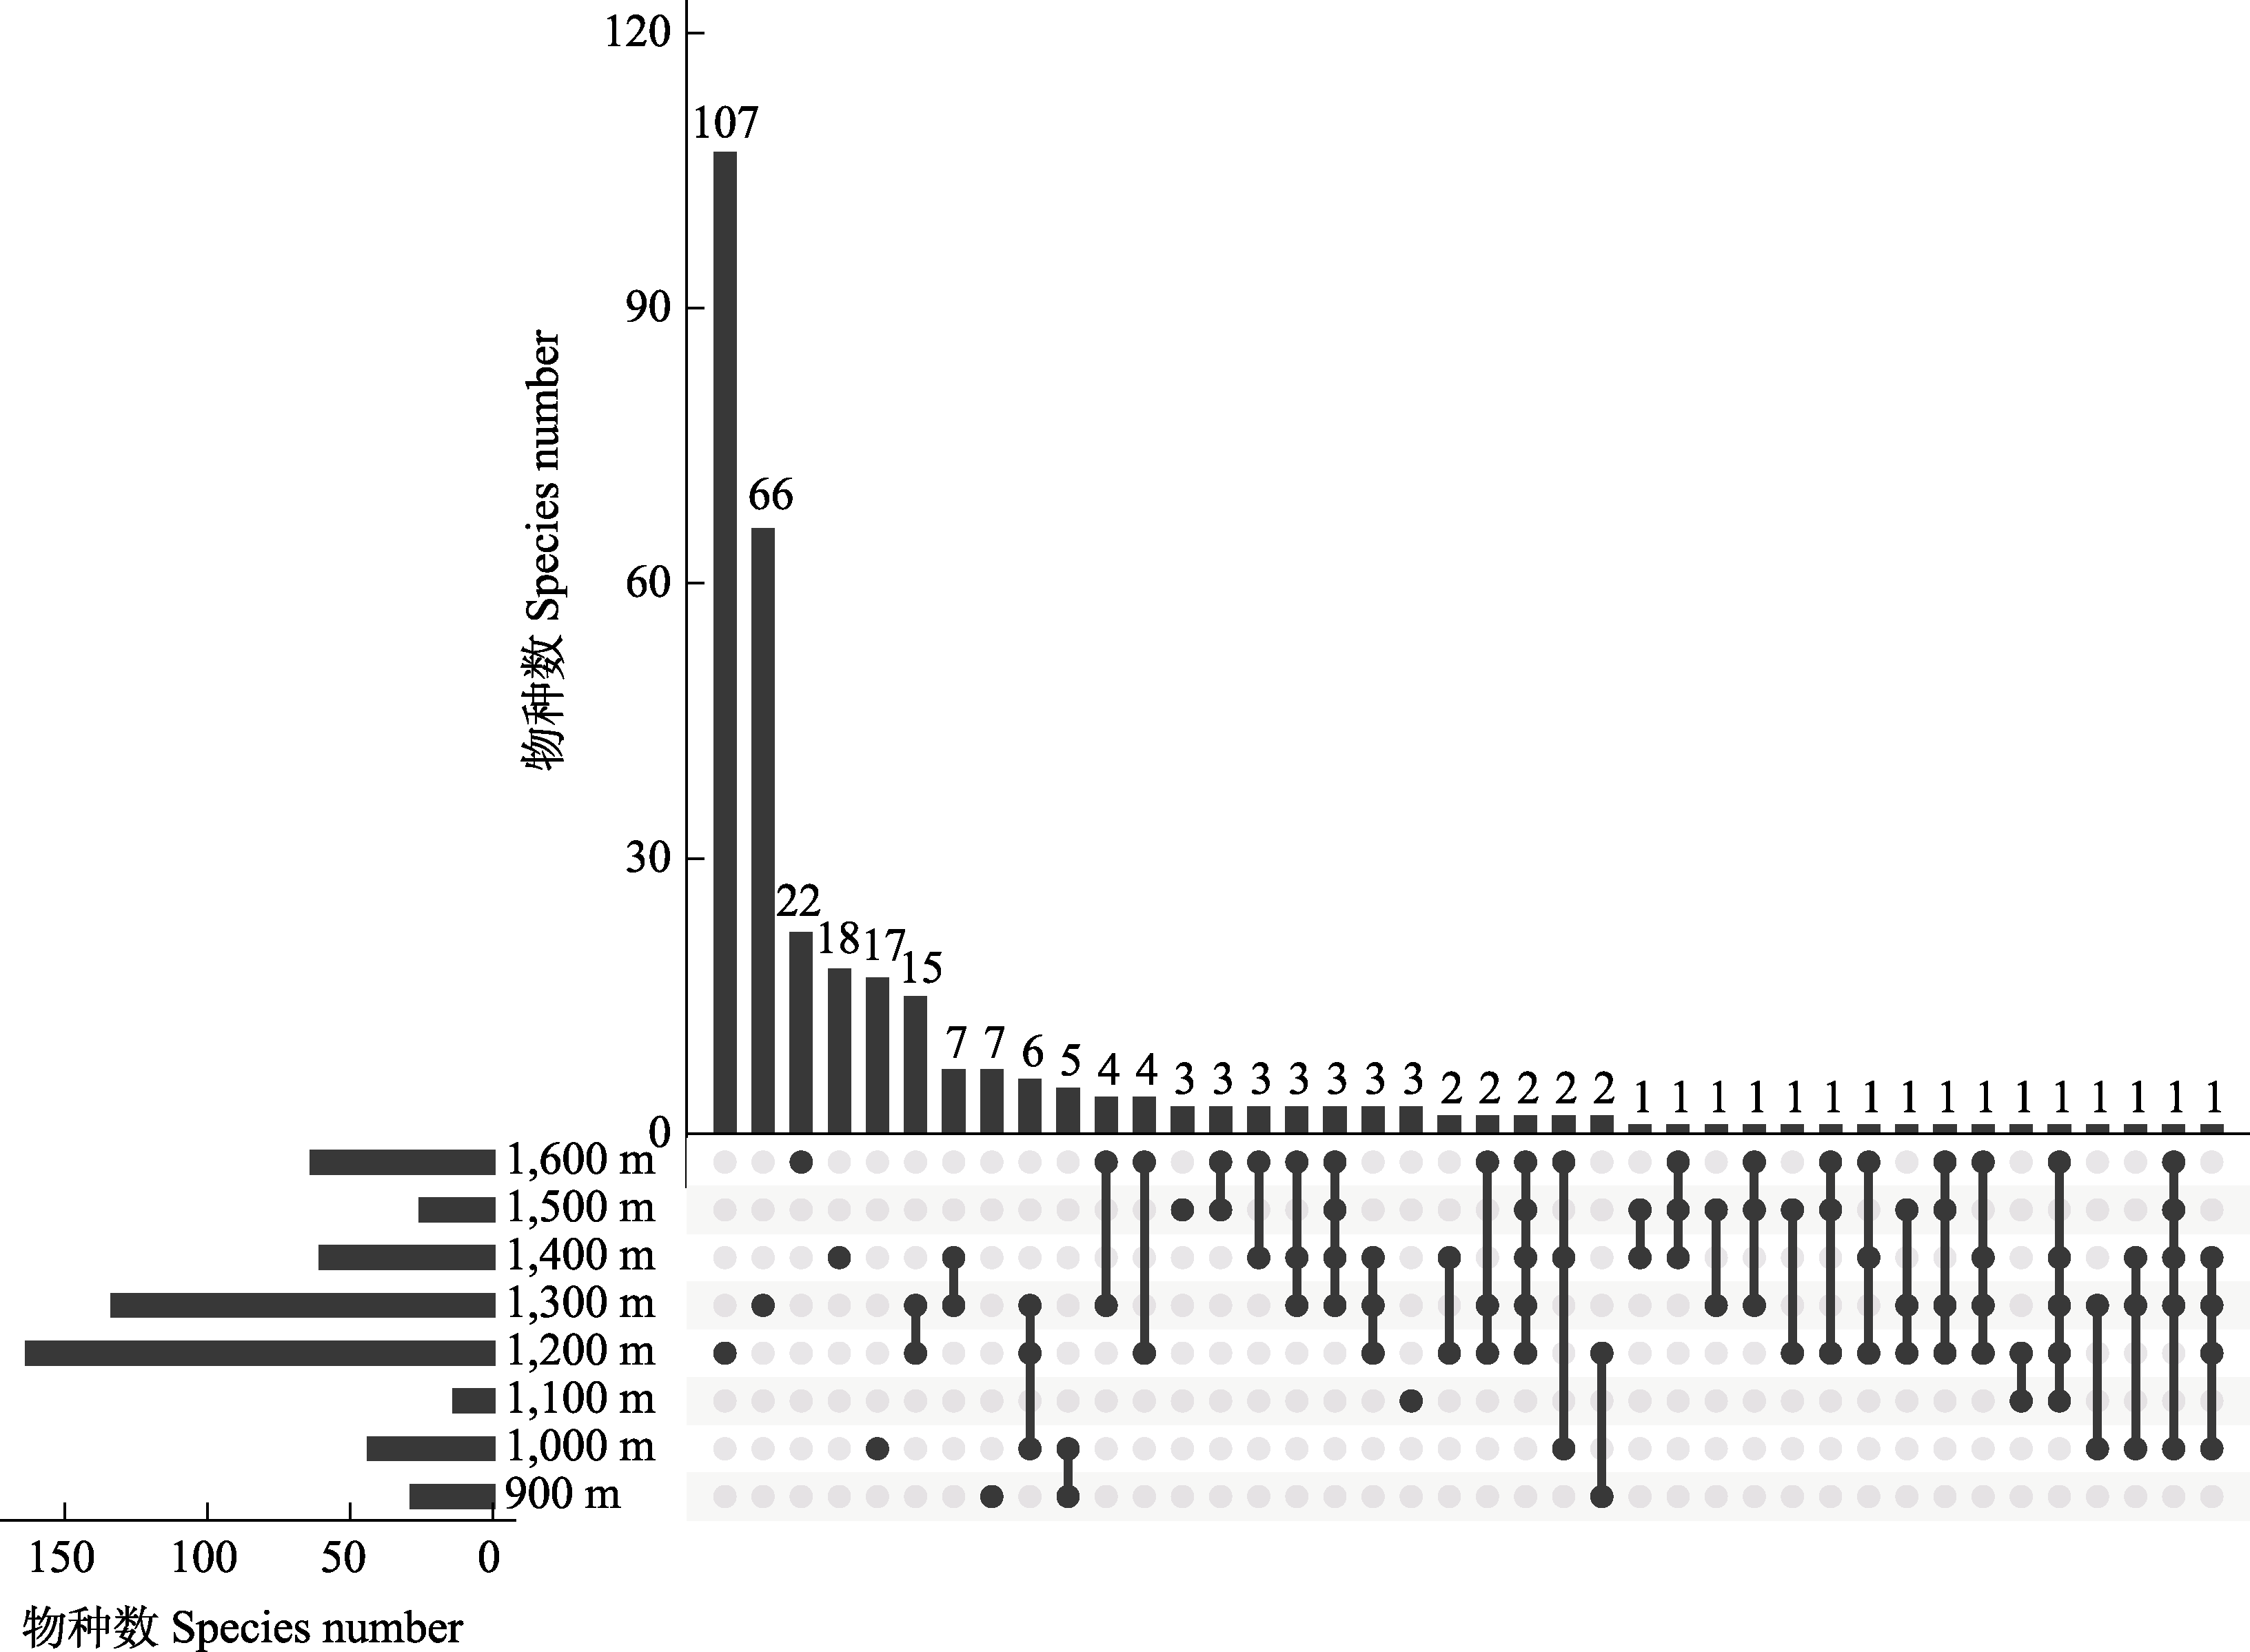
| 图3 不同海拔带的物种分布。集合图可分为上(柱状图)、下(左侧的条形图、中间的海拔和右侧的点阵图)两个部分。点阵图中单个点代表该分组的特有物种, 连接的点代表与其他分组的共有物种, 上部分柱状图用于展示不同组之间共有或独有的物种数量, 下部分左侧的条形图代表不同海拔上的物种数量情况。 |
| Fig. 3 Species distribution at different elevational bands. The UpSet plot can be divided into the upper (histogram) and the bottom (the bar chart on the left, the elevation in the middle, and the dot plot on the right) parts. In the dot plot, a single point represents the endemic species of a particular group, while connected points represent shared species with other groups. The upper bar chart is used to show the number of shared or unique species among different groups. The bottom left bar chat shows the number of species in different elevations. |
|
|