基于蛾类多样性研究人工林斑块的边缘效应
Edge effect in plantation patches based on moth diversity
基于蛾类多样性研究人工林斑块的边缘效应 |
| 段曼微, 李香, 周阳, 赵敏欣, 孙秀玲, 韩冰, 张刚, 权子豪, 李凯 |
|
Edge effect in plantation patches based on moth diversity |
| Manwei Duan, Xiang Li, Yang Zhou, Minxin Zhao, Xiuling Sun, Bing Han, Gang Zhang, Zihao Quan, Kai Li |
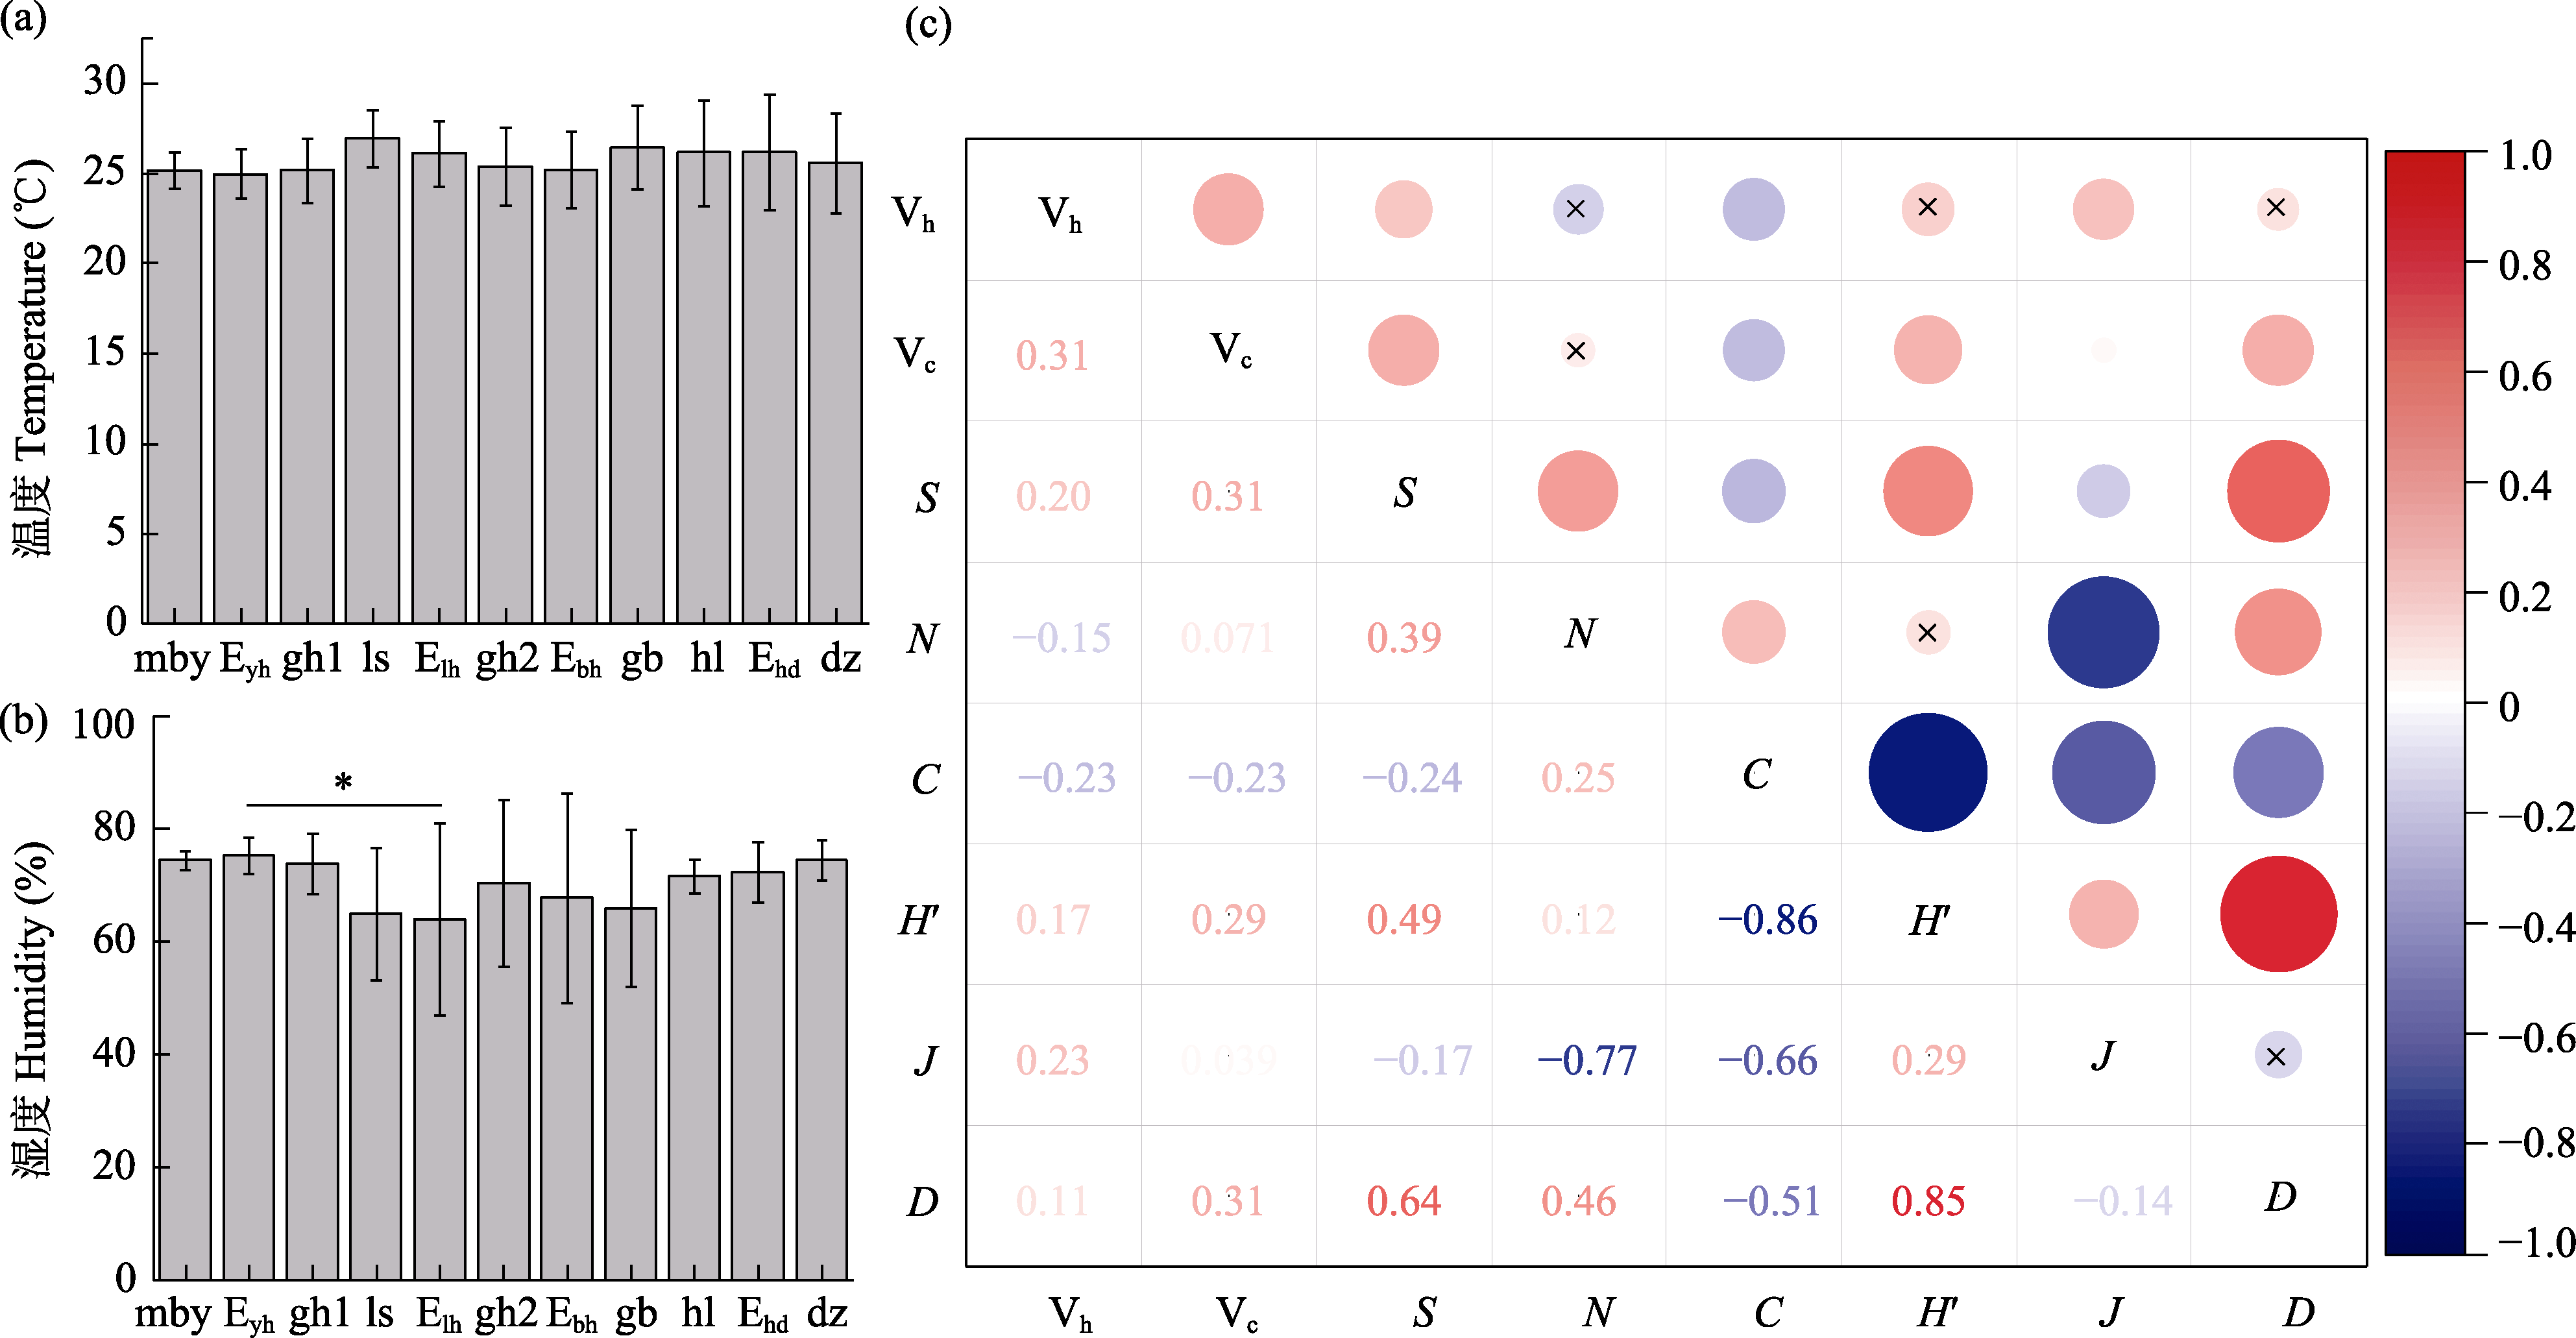
| 图8 蛾类特征指数与环境因子相关性分析。(a)温度(平均值 ± SD); (b)湿度(平均值 ± SD); (c)蛾类特征指数与植被特征因子相关性分析图, 圆圈大小代表相关性强度, “×”表示不存在显著相关性。Vh: 林下植被平均高度; Vc: 林下植被平均盖度; S: 物种数; N: 个体数; C: Simpson指数; H′: Shannon-Wiener多样性指数; J: Pielou均匀度指数; D: Margalef丰富度指数。其余缩写含义见 |
| Fig. 8 Correlation analysis between moth characteristic index and environmental factors. (a) Temperature (mean ± SD); (b) Humidity (mean ± SD); (c) The plot of correlation analysis between moth characteristic index and vegetation characteristic factors. The circle size represents the correlation strength, “×” represents no significant correlation. Vh, Height of understory vegetation; Vc, Coverage of understory vegetation; S, Species numbers; N, Individuals; C, Simpson index; H′, Shannon-Wiener diversity index; J, Pielou evenness index; D, Margalef richness index. Other abbreviations see |
|
|