中国梭梭属植物历史分布格局及其驱动机制
Historical distribution pattern and driving mechanism of Haloxylon in China
中国梭梭属植物历史分布格局及其驱动机制 |
| 张丹, 马松梅, 魏博, 王春成, 张林, 闫涵 |
|
Historical distribution pattern and driving mechanism of Haloxylon in China |
| Dan Zhang, Songmei Ma, Bo Wei, Chuncheng Wang, Lin Zhang, Han Yan |
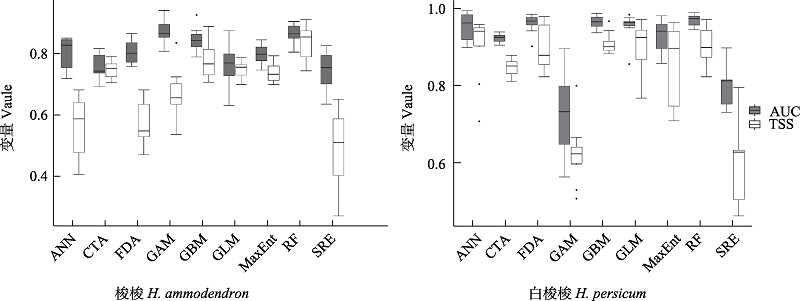
| 图1 不同模型预测精度评价。ANN: 人工神经网络; CTA: 分类树分析; FDA: 柔性判别分析; GAM: 广义相加模型; GBM: 推进式回归树; GLM: 广义线性模型; MaxEnt: 最大熵模型; RF: 随机森林; SRE: 表面分布区分室模型; AUC: 特征曲线下的面积; TSS: 真实技巧统计值。 |
| Fig. 1 Evaluation of prediction results of different models. ANN, Artificial neural networks; CTA, Classification tree analysis; FDA, Flexible discriminant analysis; GAM, Generalized additive models; GBM, Generalized boosted models; GLM, Generalized linear models; MaxEnt, Maximum entropy; RF, Random forests; SRE, One rectilinear envelope similar to bioclim; AUC, Area under the curve; TSS, True skill statistics. |
|
|