样本量不一致时的β多样性计算
The calculation of β-diversity for different sample sizes
样本量不一致时的β多样性计算 |
| 邹怡 |
|
The calculation of β-diversity for different sample sizes |
| Yi Zou |
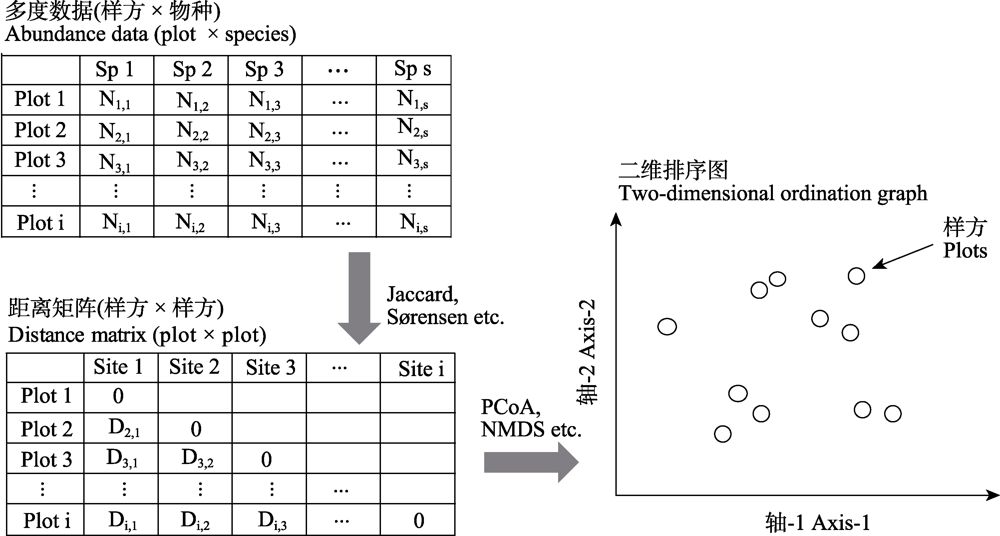
| 图1 从样方 × 物种的多度数据转换成二维排序图的流程图。原始的多度数据通过计算相异指数可以得到一个两两样方配对的距离矩阵; 该距离矩阵可以通过合适的排序方法得到二维的降序图; 二维图中的一个点代表一个样方, 点与点之间的距离代表样方之间的物种组成是相异(距离比较远)还是相似(距离比较近)。 |
| Fig. 1 Flow chart for converting plot × species multi-dimensional data into a two-dimensional ordination graph. The raw data can be calculated into a pair-wised distance matrix. The distance matrix can be descended into a two-dimensional ordination graph. One point in the ordination graph represents a sampling plot, while the distance between the points represents that the species composition between plot is dissimilar (distance is far) or similar (distance is relatively close). |
|
|