无人机高光谱影像与冠层树种多样性监测
UAV-based hyperspectral images and monitoring of canopy tree diversity
无人机高光谱影像与冠层树种多样性监测 |
| 徐岩, 张聪伶, 降瑞娇, 王子斐, 朱梦晨, 沈国春 |
|
UAV-based hyperspectral images and monitoring of canopy tree diversity |
| Yan Xu, Congling Zhang, Ruijiao Jiang, Zifei Wang, Mengchen Zhu, Guochun Shen |
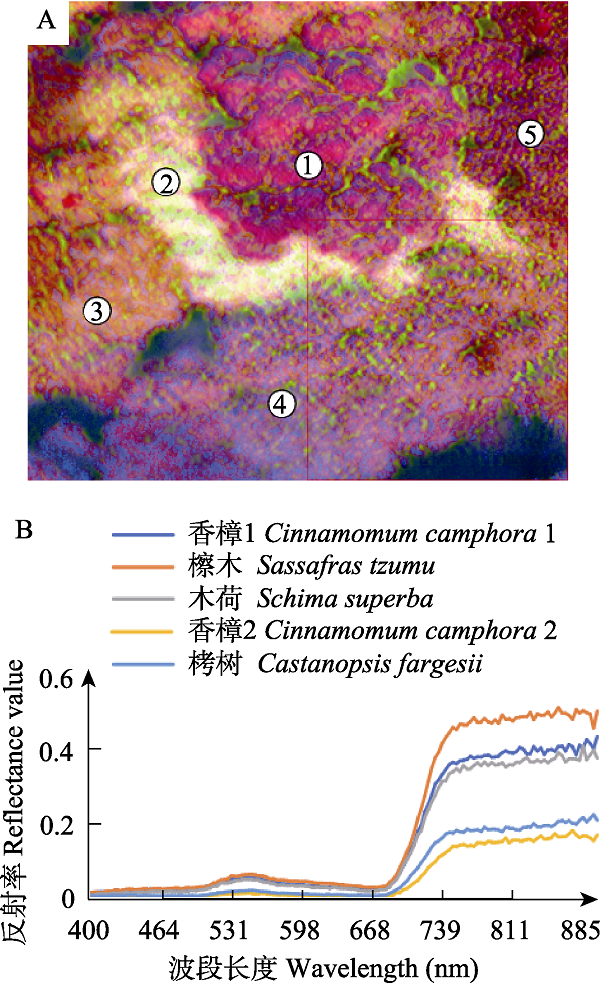
| 图3 个体的林冠层光谱特征曲线。(A)主成分分析(PCA)处理后的冠层高光谱影像, 其中数字①-⑤分别代表不同的个体。(B) 5个林冠个体的光谱反射曲线。不同的植物因其化学性质和结构的不同, 表现出不同的光谱反射曲线, 这是基于光谱物种分类的基础。 |
| Fig. 3 Individual canopy spectral characteristic curve. (A) In the hyperspectral images of forest canopy processed by principal component analysis (PCA), the numbers ①-⑤ represent different individuals; (B) Spectral reflectance curves of five canopy individuals. Different plants show different spectral reflectance curves because of their different chemical properties and structures, which is the basis of spectral species classification. |
|
|