无人机高光谱影像与冠层树种多样性监测
UAV-based hyperspectral images and monitoring of canopy tree diversity
无人机高光谱影像与冠层树种多样性监测 |
| 徐岩, 张聪伶, 降瑞娇, 王子斐, 朱梦晨, 沈国春 |
|
UAV-based hyperspectral images and monitoring of canopy tree diversity |
| Yan Xu, Congling Zhang, Ruijiao Jiang, Zifei Wang, Mengchen Zhu, Guochun Shen |
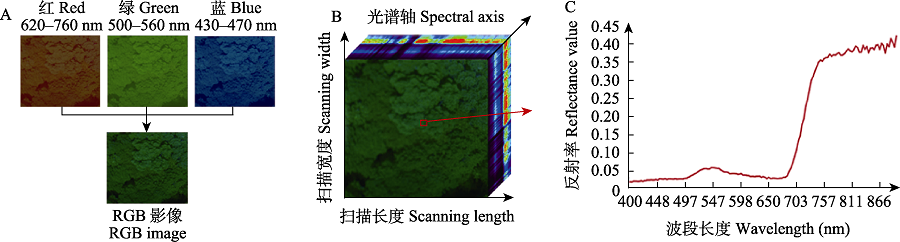
| 图1 浙江天童亚热带常绿阔叶林典型森林冠层RGB影像与高光谱影像示意图。(A)普通RGB影像, 仅包含红(620-760 nm)、绿(500-560 nm)、蓝(430-470 nm) 3层信息, 因此在RGB影像中多数常绿树种的冠层呈现近乎相同的绿色, 给冠层树种的识别造成了极大的困难; (B)冠层高光谱影像的三维立体展示, x轴为扫描长度, y轴为扫描宽度, z轴为光谱轴; (C)选定像素的光谱反射曲线, 横坐标代表波长, 纵坐标代表波段反射率值, 该像素在不同的波段下表现出不同的反射率值, 组成了一条近乎连续的光谱曲线。 |
| Fig. 1 RGB image and hyperspectral image of typical forest canopy of the subtropical evergreen broad-leaved forest in Tiantong, Zhejiang Province. (A) Ordinary RGB images only contain three layers of information: red (620-760 nm), green (500-560 nm) and blue (430-470 nm). Therefore, the canopy of most evergreen tree species is almost the same green in RGB images, which makes it very difficult to identify the canopy species; (B) Three dimensional display of canopy hyperspectral image, x-axis is the scanning length, y-axis is the scanning width, z-axis is the spectral axis; (C) The spectral reflection curve of selected pixel, abscissa represents the wavelength, ordinate represents the band reflectance value, the pixel shows different reflectance values in different bands, forming a nearly continuous spectral curve. |
|
|