基于本土最优模型模拟入侵物种水盾草在中国的潜在分布
Selecting the best native individual model to predict potential distribution of Cabomba caroliniana in China
基于本土最优模型模拟入侵物种水盾草在中国的潜在分布 |
| 范靖宇,李汉芃,杨琢,朱耿平 |
|
Selecting the best native individual model to predict potential distribution of Cabomba caroliniana in China |
| Fan Jingyu,Li Hanpeng,Yang Zhuo,Zhu Gengping |
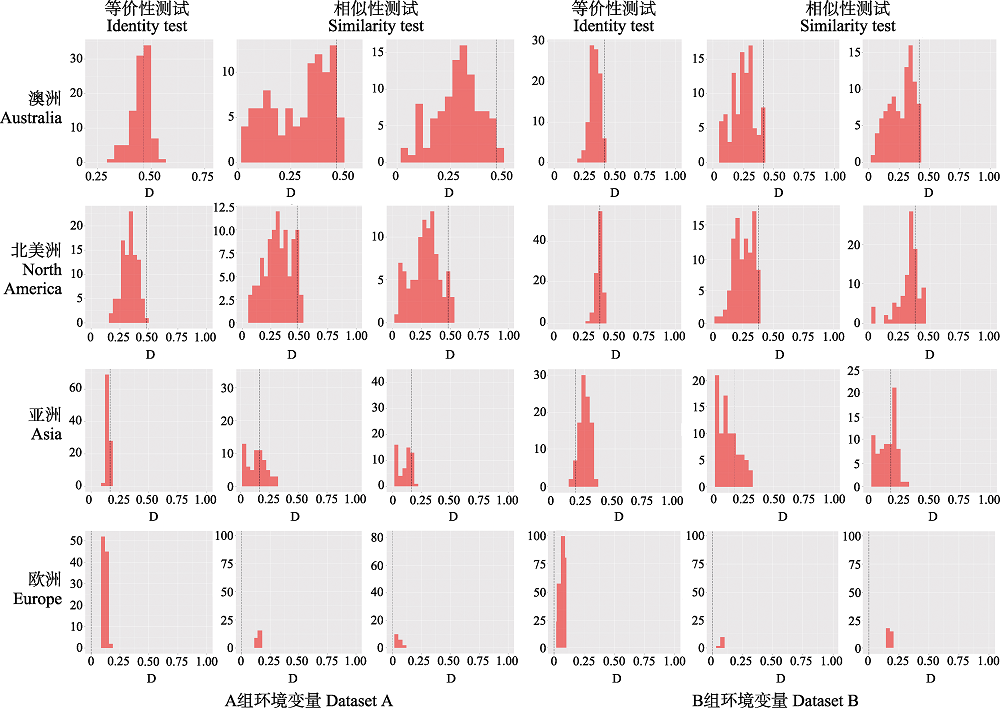
| 图3 基于两组环境变量不同水盾草地理种群的等价性与相似性测试。黑色虚线代表所观察到的实际生态位重叠值, 黑色柱状代表生态位重叠的随机分布频率。左侧: A组环境变量; 右侧: B组环境变量。A组和B组包含的环境变量见 |
| Fig. 3 Histograms of niche equivalency and similarity tests between continental populations based on the two environmental datasets. Black dotted lines represent the observed niche overlap. whereas black bars represent simulated niche overlaps. Left: A dataset; Right: B dataset. Details of dataset A and B refer to |
|
|